
 You’ve got books. You want to sell books. Once you’ve shaken down all your friends, what comes next? Many authors who use Amazon’s KDP (Kindle Direct Publishing) to publish directly to the Amazon Kindle market end up trying out Amazon Marketing Services (AMS), which allows authors to advertise their books within Amazon’s ebook ecosystem based on similar books and book searches.
There’s a catch. The AMS reporting is extremely slow and often confusing. I can’t do anything about the ridiculously long delays (sales sometimes show up days after they happen), but I hope to provide some guidance to make the reports more meaningful as you try to determine your ROI (Return on Investment).
Let’s start by walking through the reporting columns. Here’s a snapshot of a report.

Here’s the Amazon definitions of these columns.
- Impressions: An impression is generated every time your ad is displayed.
- Clicks: A click is generated when a user clicks or taps your ad.
- aCPC: Your total campaign spend divided by the total number of clicks the campaign generated.
- Spend: Not defined, but simply the total amount spent. Spend / Clicks = aCPC
- Est. Total Sales: This shows you the total price of orders customers placed after clicking your ad. This raw number has not been adjusted for declined payments or returns. Your KDP sales reports will show you the final sales numbers, which may be different from the number you see here.
- ACoS: Advertising Cost of Sales is the amount you’ve spent on a campaign divided by total sales during the campaign run dates.
This is all very straight forward, except for the minor point that the ACoS is EXTREMELY misleading. Many authors assume that if the percentage is less than 100% (in other words, that they spent less than they made on sales), they are making money.
But does an ACoS of less than 100% equal a positive ROI… Not necessarily. ACoS is based on the spend and total sales.
ACoS = Spend / Est. Total Sales
However, Est. Total Sales equals the pretax price of all the books sold, and not all that revenue is your royalty. For instance, if you charge $3.99 for your kindle book, each sale yields about $2.74 in royalties for you (plus or minus a tiny variation in the delivery fee based on the size of your book file). Your actual revenue is therefore a bit less than 70% of the total sales number listed in the report.
If you sell 10 kindle books at $3.99 each, and spent $20 on ads, the Total Sales will equal $39.90 and the ACoS will be 50%. ROI is sort of the inverse of the ACoS. ROI = Profit / Spend. So if you made $39.99 on $20 of spend, then the profit is $19.99 on $20 investment, or roughly 100%.
In this example, though, you’re actually making about $2.74 per book, or $27.40. Your real ACoS is therefore 73%, not 50%, and your real ROI is ($27.40 – $20) / $20 = 37%. Pretty good, but nowhere near 100% ROI.
And it gets much, much worse if you sell a paperback edition on Amazon.
Paperbacks that sell based on ad clicks are also listed in your Est. Total Sales, and paperbacks don’t yield anywhere near a 70% royalty typically. To use one of my own books as an example, it sells for $12.99 and I make $4.11 on the sale. To spell it out, if you sold 10 paperbacks at $12.99 with $40 of ads, your Est. Total Sales would be $129.90 and your ACoS would be 30.8%. However, your actual profit is $1.10 for an ROI of 2.75%.
AND… your real sales will be a mix of Kindle and Paperback books. So how can you easily track the real performance of your ads? A spreadsheet, of course!
Here are the columns I use to sort all this out. I’ll define the essential columns to show the ROI, then I’ll list out the full set of columns I use per ad to understand its performance.
In my current ad (see image above), I’m showing an Est. Total sales of $123.86. In general, that means I’ve sold 14 books, since the price of each of my books ends in 99 cents. However, sometimes you have a book bought on the .com site from a country with no country-specific Amazon site, and the sale price can look quite different. To double-check, click on the ad campaign name to go into the ad details.
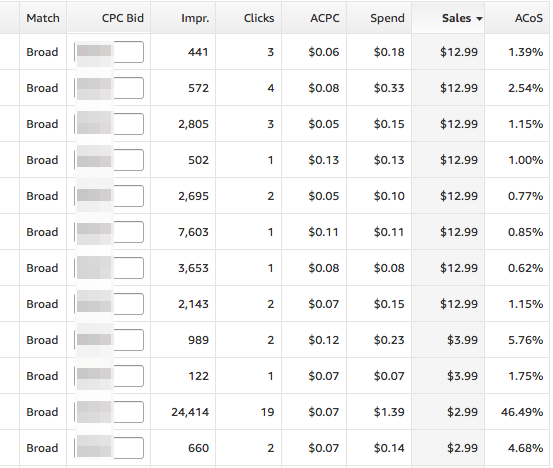
You can easily see any keywords that have an odd amount here. You can also see that I changed the price of my ebook while this ad ran from $2.99 to $3.99 and had sales at both price points.
Step one, is create a column to spot check the Total Sales amount. On my spreadsheet I call this the Sales Check. You multiply each price point you sell at ($12.99, $3.99, and $2.99 for my example ad) by the number of sales you think you have at that price point. You can use the detailed page to more or less count this total (until you get more than one sale on a given keyword), but there’s usually only going to be one obvious set of numbers. My Check column is
=8*12.99 + 2*3.99 + 4*2.99
That adds up to $123.86, the Total Sales listed by Amazon, so now I know how many of which type of book I’ve sold. From Createspace and KDP, I also know my royalties for each sale, so I create another column called Revenue. I use the same numbers for the sales multiplied by my royalty numbers.
=8*4.11 + 2*2.74 + 4*2.04 = $46.52
From these, I keep a Paperback Sales column and a Kindle sales column, just to make it really easy to calculate a Cost Per Sale (see below). In my Example, those are 8 and 6 right now.
About once a week, I go in and update these two cells, the Sales Check and the Revenue, for any active ads I have. From there, I know the actual Revenue I’ve made and can make a useful spreadsheet with my actual results. I track lots of columns, but they all are calculated from the Amazon report (Impressions, Clicks, Spend, etc) and my Revenue number. I also use a start date and current date to factor in the number of days the ad has been running.
CTR: Click through rate (clicks / impressions)
CPC: Cost per click (spend / clicks)
CPM: Cost per Thousand Impressions (spend / (impressions/1000))
KPS: Clicks per Sale (clicks / # sales)
IPS: Impressions per Sale (impressions / # sales)
CPS: Cost per Sale (spend / # sales)
Profit: my calculated Revenue column – Spend
ROI: Profit / Spend stated as a percent
All these columns are automatically updated by Excel. All I do is copy in the latest report numbers, then figure out how many of what type of sales to enter in my Sales Check column. I use those same numbers in my Revenue cell and the Paperback / Kindle sales columns, and I’ve got all the info I need to have a good understanding of my true ad performance.
Hope all this helps!
Hello Jay. I read your three books yesterday and they were very good. The stories were well written, entertaining and very creative. You may remember me. We were on Kwajalein together. My son, John and you were in school together. I worked with your father. In fact, my wife and I knew your parents in Florida and your Dad and I worked for the same company. After you all went to Liberia, I talked to your Dad by ham radio.
I am happy to see you have a wonderful family John and Tim also have families and are doing well. Perhaps they will drop a note when I tell them I have emailed you.
Take care and God Bless.